Price Monitoring

Live competitor data where you actually price.

Most price monitoring tools dump data into a dashboard nobody acts on. Retailgrid wires competitor prices, marketplace data, and DTC feeds straight into the grid where your team sets rules and approves price changes — so the loop from signal to action is hours, not days.

Retailgrid price monitoring view showing recent competitor price changes with old and new prices and percentage moves, next to a live competitor ranking with each competitor's current price and trend versus yours
What you see, not just what we collect

From raw competitor feed to ranked actions.

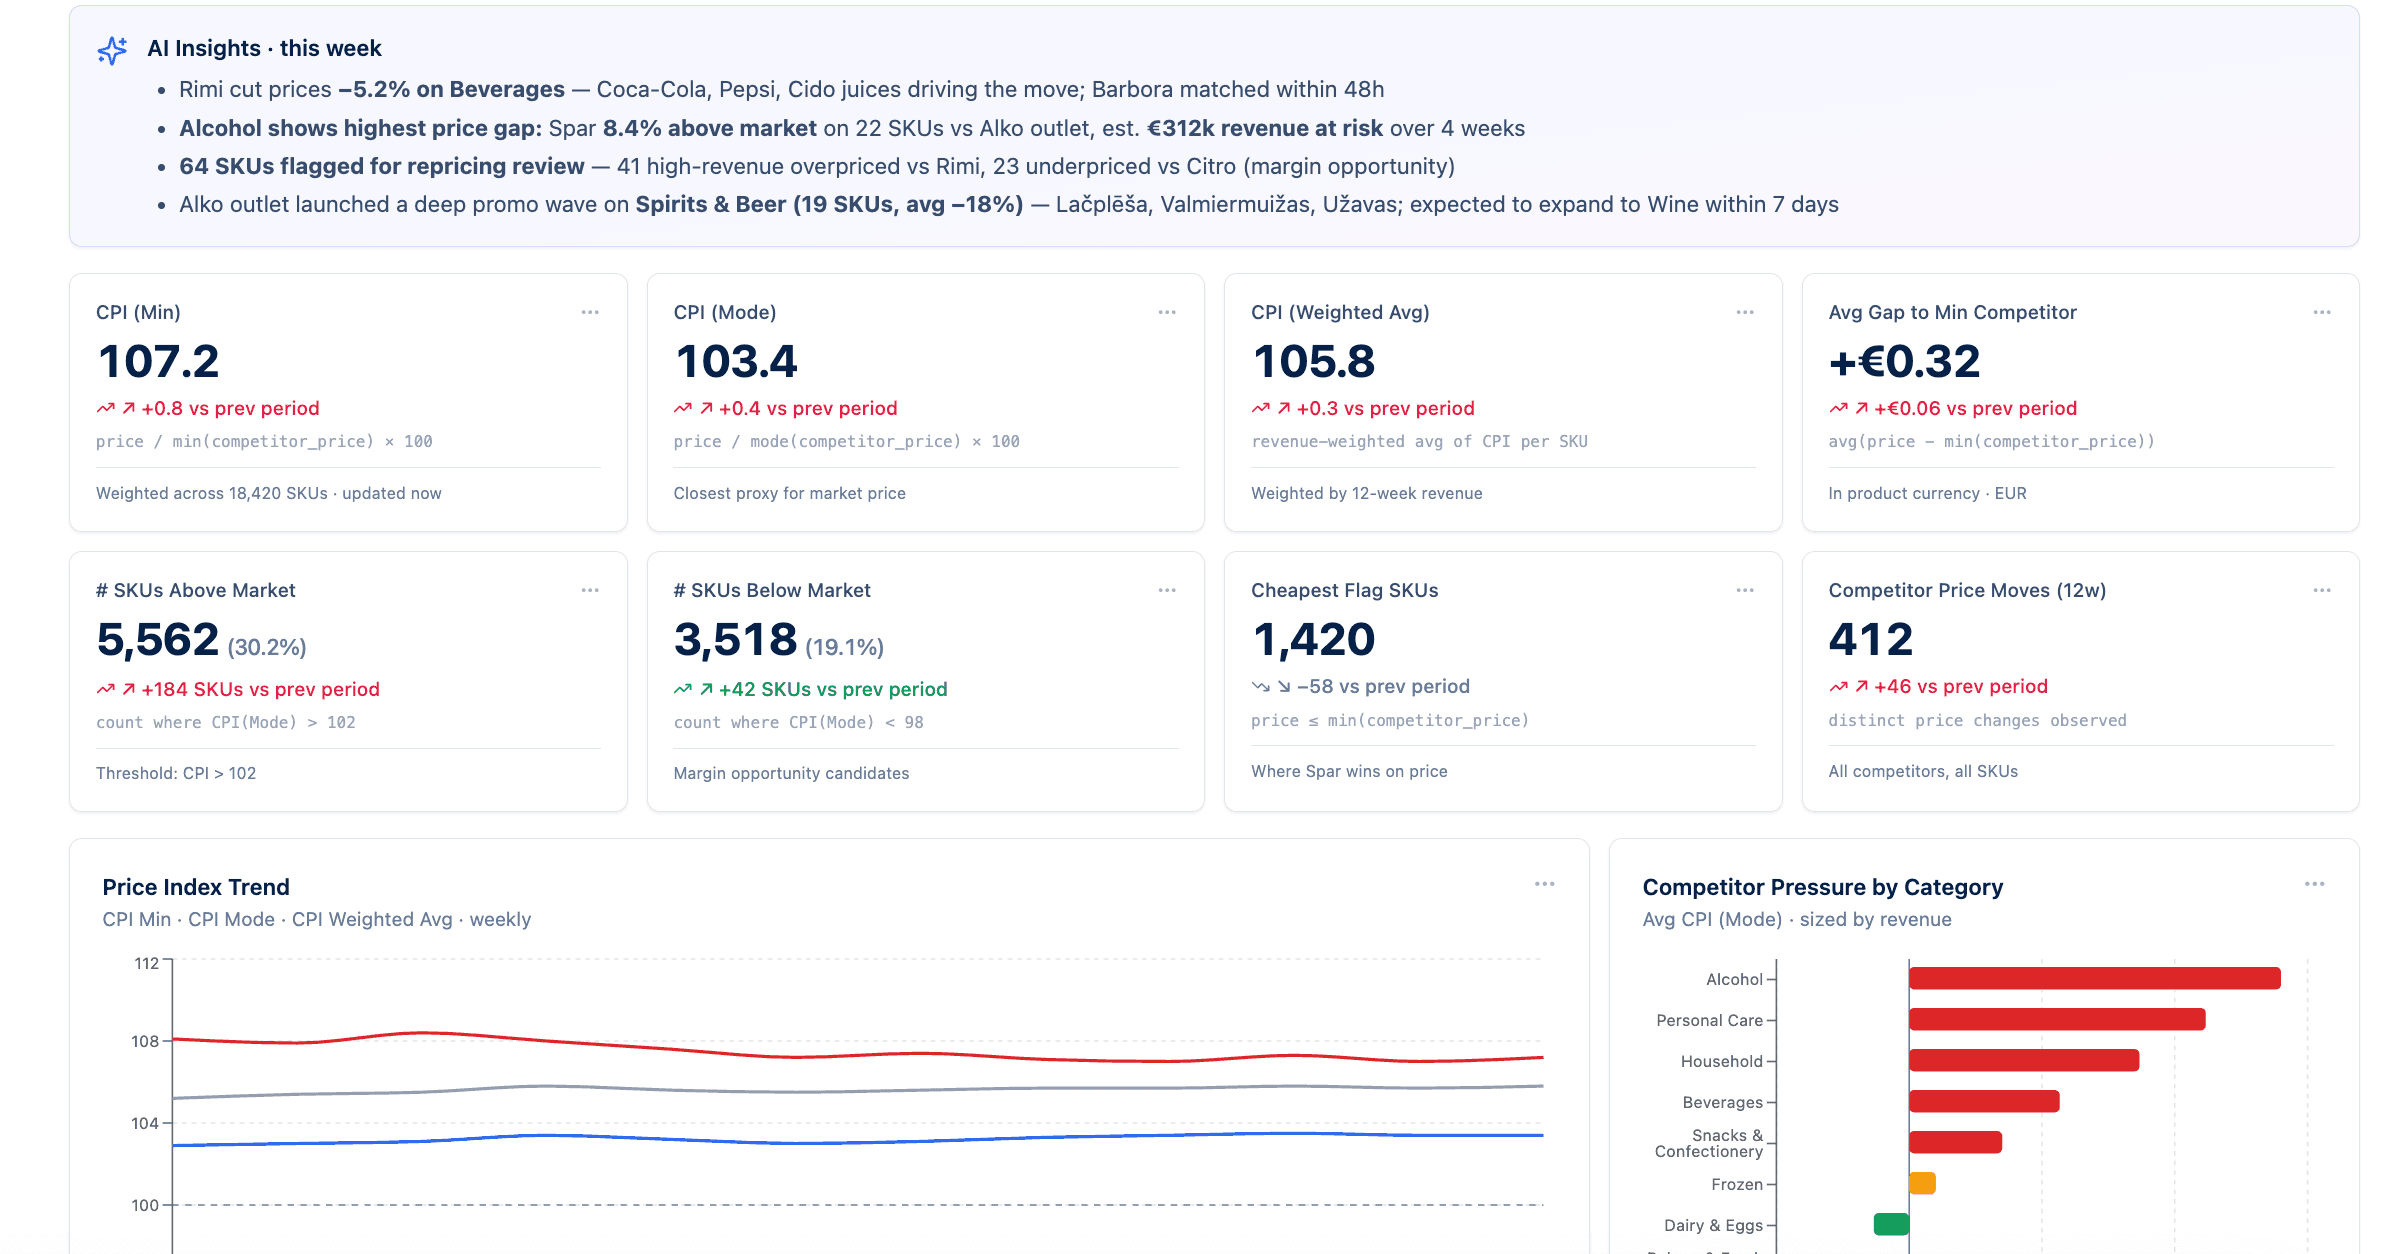
Monitor critical KPIs at a glance.

Most monitoring tools show you a feed. Retailgrid shows you the answer. The Price Monitoring dashboard pulls competitor moves, position drift, and promo intensity into one view - so the category manager knows what is broken before opening the grid.
  • Position distribution at a glance - share of SKUs above, below, and within market
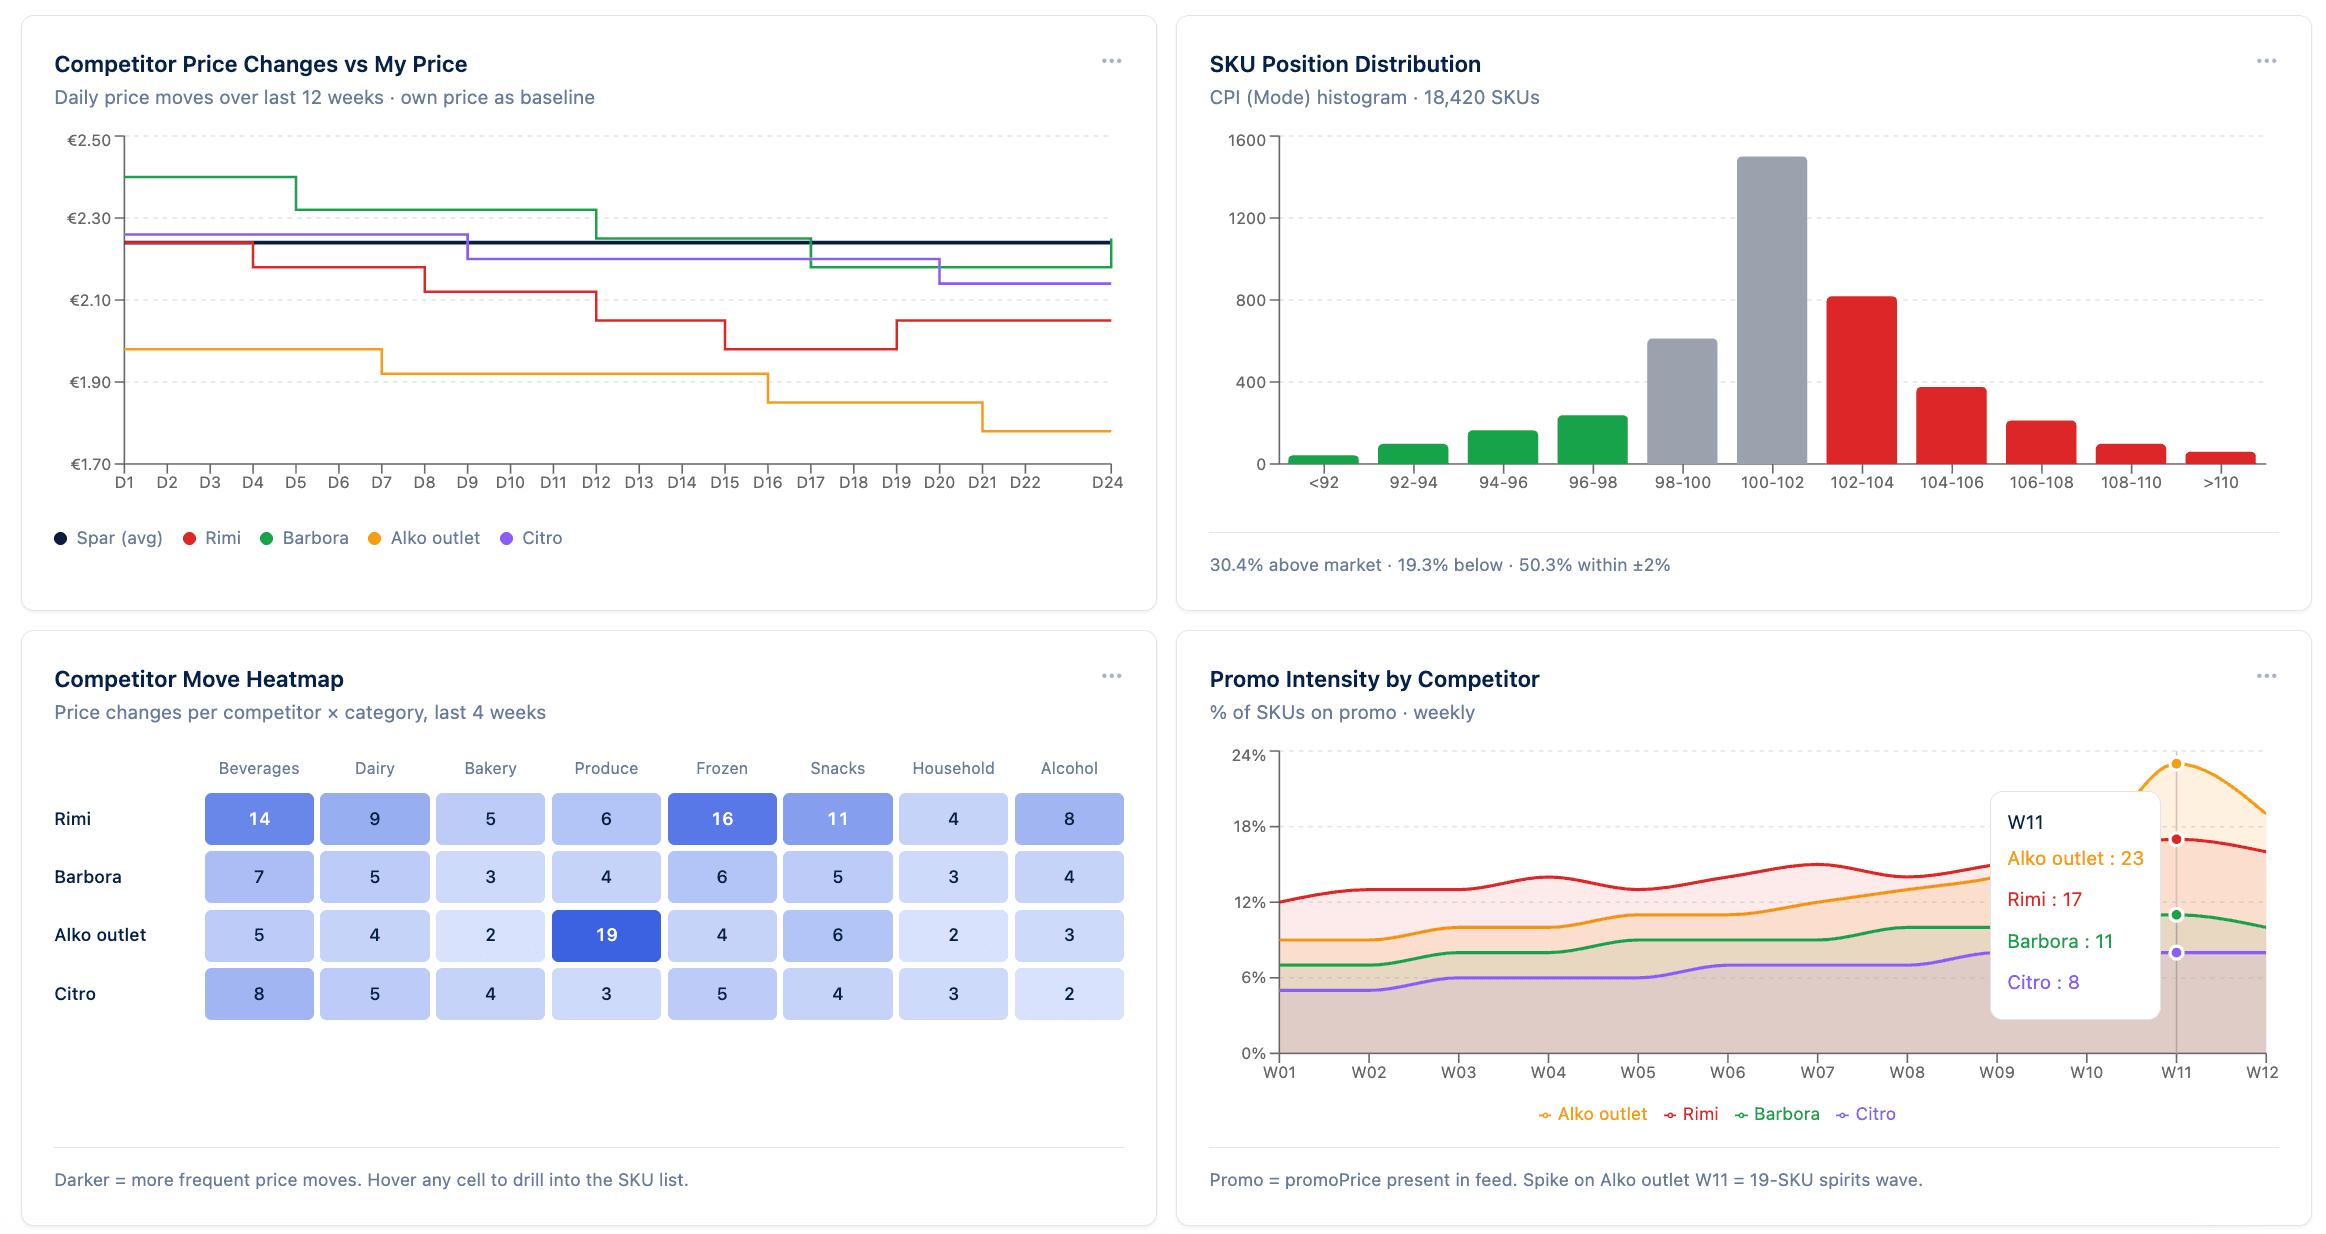
  • Daily competitor price moves overlaid on your own price as the baseline
  • Promo intensity tracked weekly per competitor and category
Retailgrid Price Monitoring dashboard surfacing critical pricing KPIs for category managers at a glance

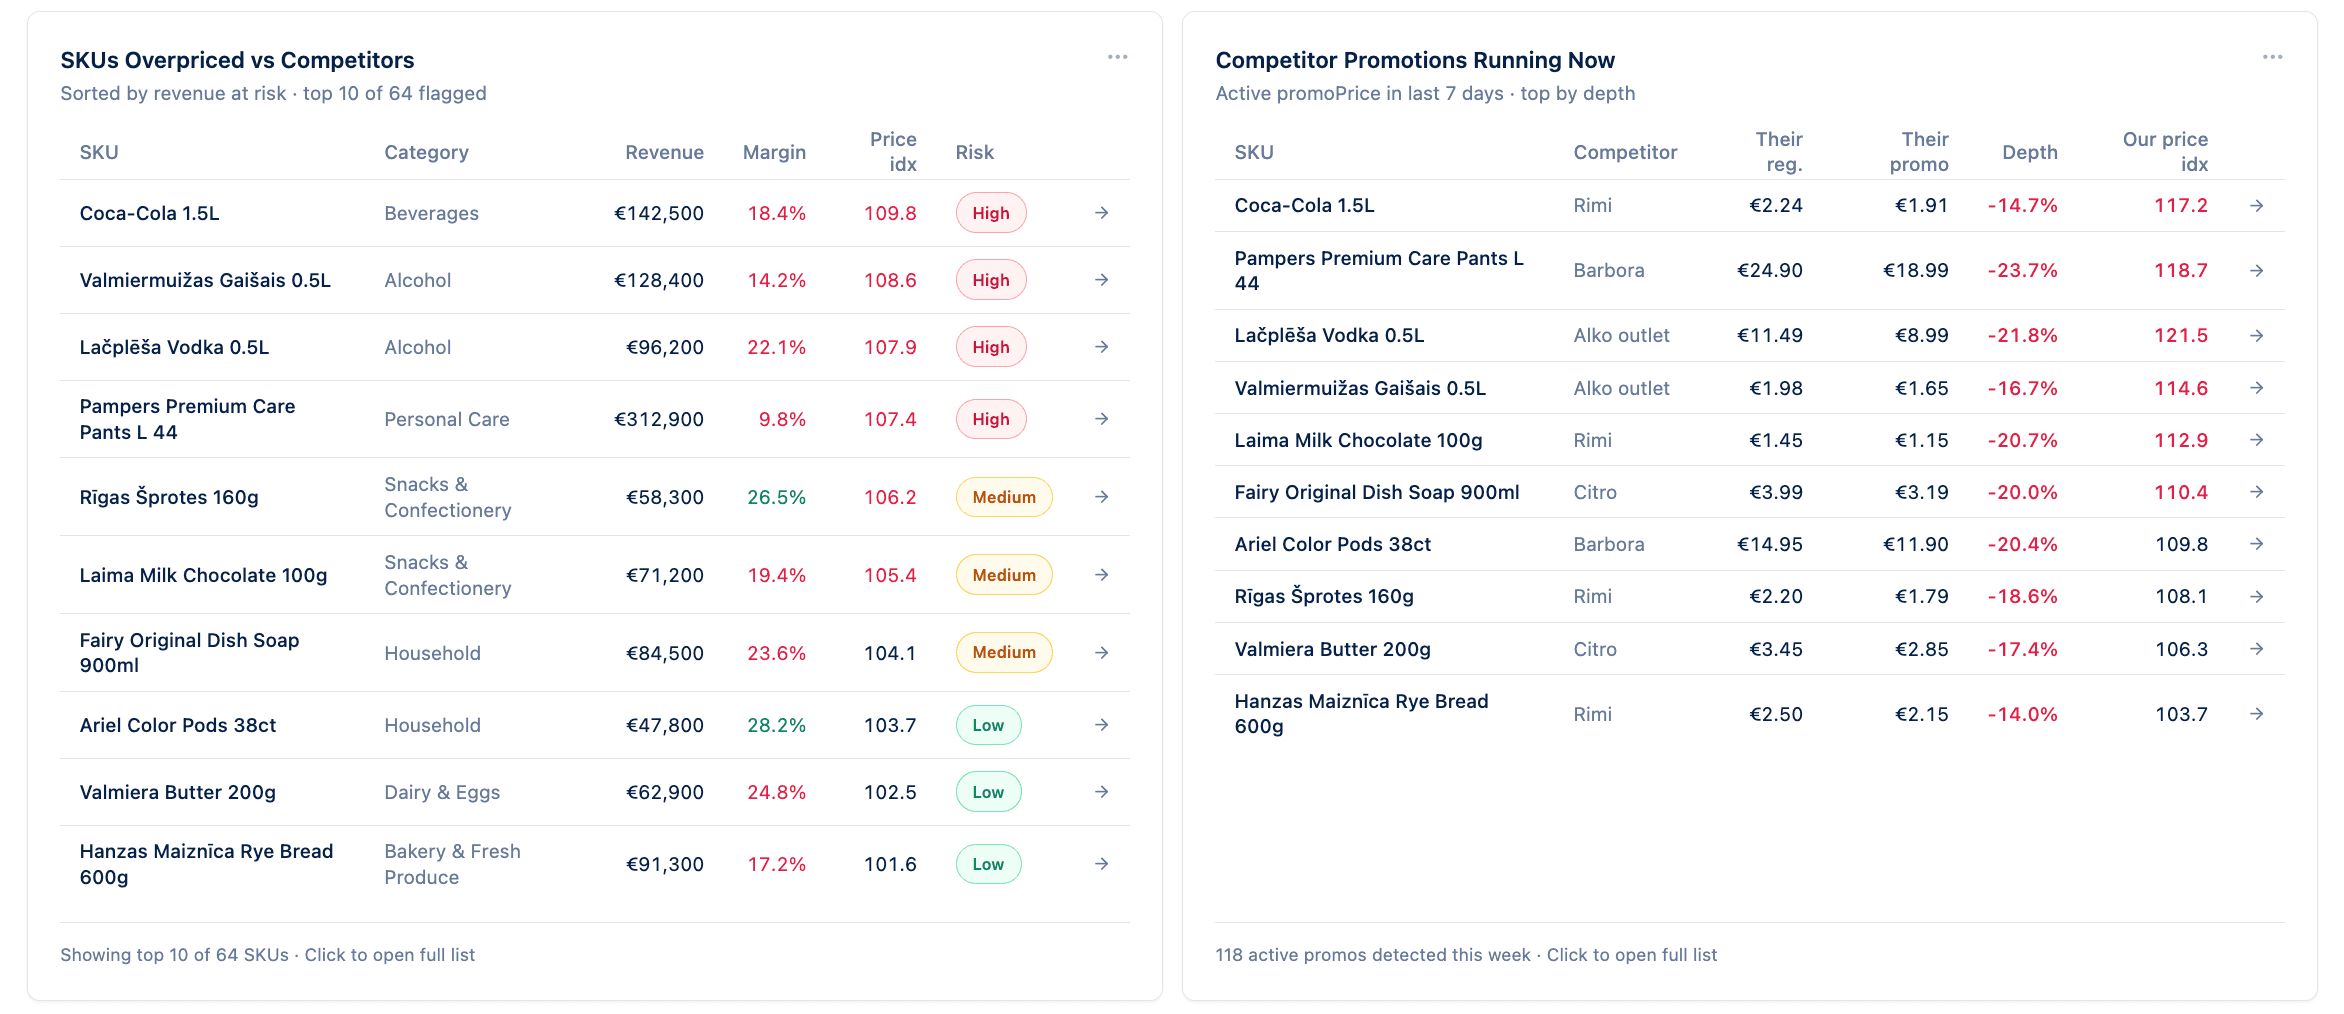
Surface the SKUs at risk. Right now.

The grid doesn't make you go hunting for trouble. The monitoring view ranks the SKUs overpriced versus competitors by revenue at risk, and surfaces the active competitor promotions you're not matching - with their depth and your price index, side by side.
  • Overpriced SKUs ranked by revenue at risk, with margin and price-index inline
  • Active competitor promotions with discount depth and the gap to close
  • Click through to open the SKU in the workspace and act
Retailgrid monitoring view with two cards: SKUs Overpriced vs Competitors ranked by revenue at risk with high, medium, and low risk badges, and Competitor Promotions Running Now showing each competitor's regular price, promo price, discount depth, and your own price index

Crawlers, marketplaces, partners — all in one feed.

Different retailers care about different sources. A fashion brand needs DTC competitor monitoring and PriceRunner. A marketplace seller needs Amazon SP-API and eBay. A grocer needs regional aggregators. Retailgrid runs all of them in parallel.
  • Own web crawling infrastructure for DTC sites and category portals
  • Marketplace APIs: Amazon SP-API, eBay, bol., ManoMano, eMag, more
  • Public data partners: PriceRunner, Idealo, Google Shopping
Connected sources · 12 active
Amazon SP-API · DE, FR, UK
14,840 SKUs
PriceRunner · NORDIC
8,212 SKUs
bol. · NL, BE
3,540 SKUs
Google Shopping · EU
12,108 SKUs
DTC · 6 named competitors
1,420 SKUs

Auto-mapping that doesn't need a 3-month project.

The single biggest reason monitoring projects fail isn't the data — it's the matching. Retailgrid handles SKU-to-competitor mapping automatically using GTINs, product attributes, and a matching engine tuned for retail. Manual mapping is the exception, not the rule.
  • GTIN-first matching where barcodes exist
  • Attribute matching for non-GTIN catalogs (brand, model, variant)
  • Match-confidence scoring with one-click manual review on edge cases
Match queue · WHT-J04-L · White Jacket
Amazon · B08K3M2R9X
GTIN match · 9.8 confidence
€84.00
Auto
PriceRunner · 312-441
GTIN match · 9.6 confidence
€85.50
Auto
Zalando · W-JKT-2042
Attribute match · 7.2 confidence
€79.95
Review

Price history that's actually queryable.

Every snapshot is stored. Every competitor move is timestamped. Pull a 90-day price history for any SKU-competitor pair in one click — or query the underlying data warehouse if you want to build your own dashboards.
  • Per-SKU price history with 4-hour resolution
  • Competitor-vs-yours overlay charts in the workspace
  • Push to BigQuery, Snowflake, or your warehouse of choice
Retailgrid competitor prices view comparing your price with the lowest, highest, and average competitor, and charting the weekly difference from your price per competitor over time
How monitoring connects to action

From competitor signal to applied price change.

Most monitoring tools end at the dashboard. Retailgrid's monitoring is the input to the agentic pricing engine — so the data has somewhere to go.

01

Configure sources

Pick the marketplaces, partners, and DTC competitors you care about. Retailgrid starts crawling and mapping competitor SKUs to yours automatically — most catalogs map in hours, not weeks.

02

Define alerts and rules

Set MAP thresholds, price gap alerts, and out-of-position triggers. Wire them into the agentic pricing rules — so a competitor move can fire a price change automatically.

03

Monitor, decide, act

Competitor data lives in the same grid as your prices and rules. Alerts route to Slack, email, or the approval queue. Every action — manual or auto — is logged against the signal that triggered it.

Built for the data sources retail actually uses

The monitoring layer that doesn't need a separate vendor.

Most retailers run pricing on three vendors: a monitoring tool, a rules engine, and a BI dashboard. Retailgrid replaces all three — so the data flows from signal to action without a CSV in between.

12+ sources
Marketplaces, public data partners, and DTC crawlers in parallel
4-hour refresh
Faster on critical SKUs. Every snapshot timestamped and stored
Auto-mapped
GTIN-first matching where available, attribute matching elsewhere

See competitor monitoring that connects to action.

A 20-minute walkthrough of how Retailgrid pulls competitor data, maps it to your SKUs, and feeds it into the pricing workflow. No signup. No separate vendor.